Vol 10 Numero 1 del 2019
DOI: https://doi.org/10.22490/21456453.2685
Livestock Greenhouse Gases Emissions Under Grazing Conditions in the Tropic
Emisiones de gases de efecto invernadero de la ganadería bajo condiciones de pastoreo en el trópico
Raúl Andrés Molina Benavides1
Zootecnista. D.Sc. Universidad Nacional de Colombia – Palmira, Colombia.
Corresponding author: ramolinab@unal.edu.co
Hugo Sánchez Guerrero2
Zootecnista. M.Sc. Universidad Nacional de Colombia – Palmira, Colombia.
hsanchezgu@unal.edu.co
Daniel Mateus3
Zootecnista. M.Sc. Universidad Nacional de Colombia – Palmira, Colombia.
dhmateuss@unal.edu.co
ABSTRACT
The livestock activity is linked to processes with environmental repercussions. Methane (CH4) and nitrous oxide (N2O) are two important greenhouse gases (GHG) emitted into the atmosphere by livestock during the processes of enteric fermentation and excreta management, which contribute to global warming. The objective of this paper was to review the amount of GHG emitted (kg CO2e) per kg of product generated from the main ruminant species (sheep, goats, buffaloes and bovines) used in tropical areas, under grazing conditions. For small ruminants, according to previous researches, emission intensities (EI) for meat was between 25 - 49.5 kg CO2e and for milk was within 5.5 and 11.2 kg CO2e; for buffaloes, EI was among 2.5 – 5.8 kg CO2e / kg FPCM and 21 – 70 kg CO2e / kg CW; for meat cattle, EI was amid 21- 76 kg CO2e; and for dairy cattle, EI was betwixt 2 – 9 kg CO2e. The differences found between the regional averages and the data for the same area of a country, can be due to different factors such as the quality of the pastures, level of intensification of the systems and climatic conditions.
Keywords: carbon footprint, emissions intensity, global warming, methane, nitrous oxide, ruminants.
RESUMEN
La actividad ganadera está vinculada a procesos con repercusiones medioambientales. El metano (CH4) y el óxido nitroso (N2O) son dos gases de efecto invernadero (GEI) importantes emitidos a la atmósfera por el ganado durante los procesos de fermentación entérica y manejo de excretas, que contribuyen al calentamiento global. El objetivo de este trabajo fue revisar la cantidad de GEI emitida (kg CO2e) por kg de producto generado a partir de las principales especies de rumiantes (ovejas, cabras, búfalos y bovinos) utilizados en áreas tropicales, bajo condiciones de pastoreo. Para los pequeños rumiantes, según investigaciones anteriores, las intensidades de emisión (IE) para la carne estaban entre 25 y 49.5 kg CO2e y para la leche entre 5.5 y 11.2 kg CO2e; para los búfalos, la IE estaba entre 2.5 - 5.8 kg CO2e / kg leche y 21 - 70 kg CO2e / kg carne; para el ganado de carne, la IE estaba entre 21- 76 kg CO2e; y para el ganado lechero, la IE fue de 2 a 9 kg de CO2e. Las diferencias encontradas entre los promedios regionales y los datos para una misma área de un país pueden deberse a diferentes factores, como la calidad de los pastos, el nivel de intensificación de los sistemas y las condiciones climáticas.
Palabras clave: calentamiento global, huella de carbono, intensidad de emisión, metano, óxido nitroso, rumiantes.
INTRODUCTION
Livestock production is the largest user of agricultural lands worldwide, a fact that carries a significant imprint on the natural resources in which it sustains its activity (FAO, 2015). Livestock uses 30% of the non-frozen land surface for grazing, and 33% of the world agricultural area is dedicated to producing food for these animals (FAO, 2006). In terms of water resources, 32% of freshwater is used to provide direct livelihood and economic benefits to at least 1.3 billion producers and retailers (Herrero, Thornton, Gerber & Reid, 2009; Thornton, 2010).
Between 2000 and 2013, the livestock inventory grew; small ruminants such as sheep and goats grew by 10 and 33%, respectively; for their part, cattle grew by 14% and buffaloes by 21% (FAO, 2015). Likewise, global consumption per capita of products derived from livestock activity has more than doubled in the last 40 years (FAO, 2015) and it is estimated that due to the growth of the world population, the trend of better income and urbanization will remain in developing countries (Herrero et al., 2016).
Although the productivity per animal (kg/animal/day) and the crops (t/ha/year) has intensified in many regions of the world, the expansion of the agricultural frontier has also played a preponderant role in the increase of production, mainly in places in Africa and Latin America. If these trends continue, they could lead to significant increases in biodiversity loss, greenhouse gas emissions and other environmental impacts (Herrero et al., 2016).
In terms of greenhouse gas (GHG) emissions, livestock is an important source in the world, generating carbon dioxide (CO2), methane (CH4) and nitrous oxide (N2O) throughout the production process. This activity contributes directly through respiration (CO2), enteric fermentation (CH4) and manure (CH4 and N2O), and indirectly through activities developed during food production (fertilization (N2O) of crops) and conversion of forests in grasslands (CO2) (Hristov et al., 2007). It is estimated that the livestock sector contributes with 14.5% of global anthropogenic emissions, where meat and milk represent 41% and 21%, respectively (Gerber et al., 2013).
The tropics dominate the scenario of livestock activity, in terms of the number of animals, total production and number of beneficiaries (producers and consumers) (Oosting, Udo, & Viets, 2014). Due to its larger inventory, the contribution to greenhouse gas emissions is very relevant worldwide, a fact that has aroused the interest of scientists and decision makers in recent years (Herrero et al., 2011).
Therefore, this article has as main objective to review the contribution of livestock (cattle, buffalo, goats and sheep) in grazing under tropical conditions on greenhouse gas emissions (CO2, CH4 and N2O). Throughout the paper there will be a brief description about ruminants, what the production process of these gases are, how the livestock activity in pasture is and finally, results found on GHG and EI.
RUMINANTS
Herbivores can be classified into two groups, monogastric and polygastric. The first ones (equines, rabbits and elephants) have only one stomach that does not offer conditions for fermentative digestion. In these species, the fermentation chamber is found in the caecum and in the colon, very well developed organs. The second group have more than one stomach. Polygastric in turn can be classified into Pseudo ruminates and Ruminants. The first ones have two pre-stomachs (reticulum and rumen) and a true stomach (abomasum), in this group there are llamas, camels, alpacas and vicuñas. While, ruminants have three pre-stomachs (reticulum, rumen and omasum) and a true stomach (abomasum), in this group are cattle, sheep, goats, buffaloes, deer, reindeer, giraffes, elk and antelopes (Membrive, 2016). The word Ruminate comes from Latin Ruminare, which means "to chew again".
Ruminants have the ability to obtain their nutrients from plants rich in lignin and cellulose, through the action of specialized microorganisms found in their four compartments. The process begins with the chewing and salivation of the vegetable mass ingested. This bolus passes to the great rumen, where the muscular action agitates it and mixes it with the microorganisms, there begins the fermentation of the food. The animal then regurgitates this material, chews again, swallows again and so on. This repeated process creates a larger surface area for microorganisms, which continue to digest the food and extract its nutrients (Garnett et al., 2017).
When microorganisms break down and digest carbohydrates, they generate fatty acids, nutrients that the ruminant can absorb into their blood through the walls of the rumen (Garnett et al., 2017). Ruminants obtain between 50 and 70% of their energy from the fatty acids produced in the rumen (Membrive, 2016). During this metabolic process, hydrogen is produced, which is later incorporated into methane (CH4) that ruminants burp - this is enteric fermentation (Garnett et al., 2017).
The advantage of this metabolic process is that ruminants can digest fibrous material with a high content of structural carbohydrates, such as grass, husks, stems, among others, which monogastric ones such as pigs, chickens and the same people can not digest. The disadvantage is that methane emissions are generated throughout the process.
Greenhouse gases emitted by ruminants
Ruminants contribute with three greenhouse gases, CO2, CH2 and N2O. Due to this paper focuses on livestock under grazing conditions, the CO2 emitted by the animals is not considered as it would be counteracted by the CO2 that is captured by the pastures in the process of photosynthesis and that is released in the form of O2. Then, the contribution will be in three ways: enteric methane and methane and nitrous oxide from the handling of excreta (IPCC, 2006).
Enteric methane is produced by fermenting the food within the digestive system of animals (rumen-reticulum). In this digestive process carbohydrates are broken by microorganisms and converted into simple molecules (for example, volatile fatty acids) in order to be absorbed by the bloodstream through the walls of the rumen. During this metabolic process, hydrogen is produced, which is readily incorporated into methane. The amount of CH4 released depends on the type of digestive tract, age, weight of the animal and the quality and quantity of food consumed. Generally, the higher is the consumption of food, the greater is the emission of methane. The most relevant aspect in methanogenesis is the ratio of acetic acid: propionic acid. 90% of methane production originates in the reticulum-rumen and the remaining 10% is produced in the posterior digestive tract, which is mostly absorbed into the blood, transported to the lungs and expelled through the nose, during breathing. The methane produced in the rumen is eliminated, through the mouth and nose, through belching and breathing (IPCC, 2006).
Methane from excreta (feces and urine) occurs during storage and treatment and the CH4 that is deposited on the pastures. The amount of CH4 emitted depends on the amount of excreta produced (production rate and number of animals) and the portion of excreta that is decomposed anaerobically (handling). When excreta are handled in liquid form (lagoons, ponds, tanks, wells), it decomposes anaerobically and can produce significant amounts of CH4 (temperature, storage and time affect production). When the excreta is handled in solid (piles) or when they are deposited on the pastures, these tend to decompose under more aerobic conditions and less CH4 is produced (IPCC, 2006).
N2O emissions from excreta occur in two ways: i) the direct route occurs through a combination of nitrification and denitrification of the nitrogen contained in the excreta. Emissions depend on the nitrogen and carbon content of the excreta, and the duration of storage and its treatment. In summary, the production and emission of N2O from the excreta handled requires the presence of nitrites or nitrates in an anaerobic environment preceded by aerobic conditions necessary for the formation of these oxidized forms of nitrogen; ii) The indirect way is the result of the losses of volatile nitrogen that occurs mainly in the form of ammonia and NOx. The fraction of excreted organic nitrogen that is mineralized in ammoniacal nitrogen during manure collection and storage depends mainly on time and, to a lesser degree, on temperature. The simple forms of organic nitrogen such as urea (mammals) and uric acid (poultry) are rapidly mineralized to ammoniacal nitrogen, which is highly volatile and diffuses easily into the surrounding air (IPCC, 2006).
The main source of GHG emissions in ruminant production is CH4 from enteric fermentation, which represents around 47% of the sector's emissions and more than 90% of the total methane emissions. The N2O emissions from food production and N deposited during grazing (feces and urine) account for 24% of GHG emissions from the sector (Opio et al., 2013).
Cattle are the main contributor of GHG (65%) of the livestock sector globally, while pigs, chickens, buffaloes and small ruminants have lower levels of emission, each one represents between 7 and 10% of the total emissions of the sector (Gerber et al., 2013).
LIVESTOCK SYSTEMS IN THE TROPICS
Livestock represents 30% of the agricultural surface through the direct use of pastures and the crops for their feeding (Herrero et al., 2013). Although, a small proportion of the grassland is dedicated to the intensive production of ruminants, 80% of these are associated with extensive grazing systems. These are found predominantly in areas of low rainfall, both in temperate and tropical regions and often in developing countries (Roxburgh & Pratley, 2015).
The tropics dominate the global scenario of this activity, in terms of the number of animals, total production and number of beneficiaries, when compared to the livestock production of the western world (Oosting et al., 2014).
Livestock feeding in the tropics generally depends on low quality forages, often deficient in nitrogen and digestible energy, which limits animal productivity and increases greenhouse gas emissions (Chaokaur, Nishida, Phaowphaisal & Sommart, 2015). Pastures with high levels of fiber negatively affect the degradability of the vegetal material at the ruminal level, which has a direct effect on the increase of the excretion of nutrients and on the enteric emissions of CH4. Additionally, the low quality of the pastures affects the assimilation of the nitrogen contributed in the diet, therefore, the losses of this mineral are greater through urine and manure (Molina, Sanchez, Campos, Atzori, & Morales, 2017).
Livestock can be raised in different systems, and these can be classified according to the extension in which livestock is associated with crops, type of animal, food source and agro-ecological zone, among others. However (Seré and Steinfield, 1996), for ease have classified the production systems in three main categories:
Mixed crop-livestock systems: They are those in which less than 90% of the dry matter of the food for the animals comes from pastures; the rest can come from crop byproducts, crop residues, woody crops and grains. From the economic component, more than 10% of the total value of production comes from activities not related to livestock.
Landless systems: Systems in which less than 10% of the dry matter of the food offered to the animals is produced on the farm. The food offered is commercial, a mixture of cereals and oilseeds.
Grazing systems: In these systems, more than 90% of the dry matter of the food offered to the animals comes from the pastures. The other 10% of the diet can come from supplementation (hay, molasses and other supplements). From the economic component, less than 10% of the total value of production comes from activities not related to livestock.
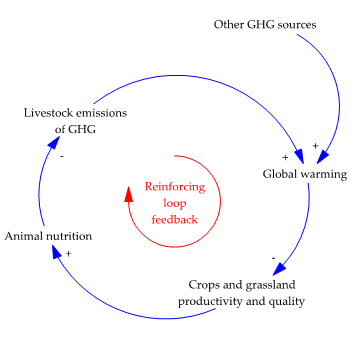
It is widely recognized that an increase in GHG concentrations in the atmosphere can cause global warming. This effect can have an impact on the production and quality of the crops, even more, for livestock systems under grazing and mixed conditions. In figure 1, we can observe the feedback process that arises between livestock activity, crops (including pastures), GHG emissions and global warming.
Figure 1. Causal diagram showing the reinforcement feedback loop that is formed between global warming, crops and livestock.
For understang figure 1, the convention for drawing a causal loop diagram is simple, consisting of a set of variables connected by arrows denoting the causal influence. The arrow always part of the independent variable (A) to the dependent variable (B). Each arrow is assigned a polarity (+/-) indicating the variable B changes as a function of the variable A (all other variables assumed constant). If the sign is +, the two variables move in the same direction; if the sign is -, the two variables move in opposite directions. In some cases, where the variable part of the causal arrow can become site arrival of a causal link, giving rise to a feedback loop. These loops are also assigned polarity. If the number of negative causal relationships is even, the loop is reinforcing (R / +), otherwise it will balance (B / -). Balance loops seek to regulate the system, reinforcing loops promote the growth or decline of the same (Molina, Sánchez, & Atzori, 2018).
METHODS TO ESTIMATE THE GREENHOUSE GASES PRODUCED BY LIVESTOCK
Estimating the environmental impact of a human activity is complex, since there is a variety of interrelationships between the infrastructure, the surrounding environment and the chemical and biological processes that regulate. There are special difficulties when estimating the environmental impact of agricultural systems, since agriculture is both a great source and at the same time a sink for pollutants or substances for the environment. In addition, there is a wide variety of farming systems and techniques for measuring nutrients or gas emissions are often too sophisticated to be used in commercial farms (Pirlo & Caré, 2013). Although there is clear evidence that agriculture plays a minor role compared to the energy sector of developed countries, there is great concern about greenhouse gas emissions from livestock (Steinfeld et al., 2006).
Greenhouse gases are the gaseous components of the atmosphere, both natural and anthropogenic, that absorb and emit radiation at certain wavelengths of the infrared radiation spectrum (IPCC, 2001). The modification in the composition of gases (water vapor, carbon dioxide, nitrous oxide, methane and ozone) in the atmosphere has led to climatic alterations in relation to its historical behavior, known as Climate Change (Gerber et l., 2013).
Depending on the approaches used and the coverage of emissions, estimates from various sources (IPCC, FAO, EPA, among others) account that livestock contributes to global anthropogenic emissions between 7 and 18% (Hristov et al., 2013).
The Intergovernmental Panel on Climate Change (IPCC) developed the concept of global warming potential (GWP) to compare the ability of each GHG to trap heat in the atmosphere relative to other gases. The GWP of a GHG is defined as the ratio in time between the integrated radiative forcing and the instantaneous release of 1 kg of the trace substance in relation to that of 1 kg of a reference gas. The reference gas used is CO2, therefore, the weighted emissions of GWP are measured in CO2 equivalent (IPCC, 2006). The transformation of GHG to CO2e is done using the equivalences proposed by the IPCC (IPCC, 2007), where 1 kg CO2 = 1 kg CO2e; 1 kg CH4 = 25 kg CO2e and 1 kg N2O = 298 kg CO2e.
The total amount of GHGs emitted by an organization, activity, product, service or person is known as a carbon footprint (Rotz, Montes, & Chianese, 2010). The objective of this footprint is to compare the environmental performance of two or more production systems in order to explore the possibilities of reducing emissions. This footprint can also be used as an indicator of progress at the farm and regional level in the efficient use of natural resources (Pirlo & Caré, 2013). Generally, this footprint is expressed in kilograms or tons of CO2e. When this amount of gases emitted we dilute them by the amount of product generated, we speak of emission intensity (EI), which is expressed in kg CO2e / kg of product.
Among the methodologies used to estimate GHG emissions from livestock, stand out the proposal by the IPCC, which estimates the emissions of methane (enteric and excreta) and nitrous oxide (excreta management) within the production system (IPCC, 2006); and the life cycle analysis method, which includes additional sources in the supply chain, from product conception to retail, emissions arise from food production and animal husbandry as well as from processing and transport of livestock products to the market (FAO, 2010).
EMISSIONS OF THE RUMINANTS
GHG emissions from small ruminants
The production systems of small ruminants (sheep and goats) are important because they can be developed in areas with difficult landscapes where other activities could not be carried out, and the products generated by them (milk and meat) are an invaluable source of protein (Zervas & Tsiplakou, 2012). Sheep and goats represent 56% of the world population of domestic ruminants (Marino et al., 2016). According to (Steinfeld et al. 2006), the stock of sheep and goats in developing countries represents 76% of the world population.
At a global level, small ruminants contribute 6.5% of GHG emissions in the livestock sector, of which 62% is attributed to meat production and 27% to milk production (Marino et al., 2016). With 428.8 million tons of CO2e emitted, 59% is attributed to the production of sheep while the rest is attributed to the production of goats (Opio et al., 2013). Above 55% of the emissions of small ruminants (milk and meat) is attributed to enteric fermentation, 35% is assigned to food production, while emissions from excreta management are very low, because the animals deposit their feces on the pastures (Gerber et al., 2013).
On average, the EI of small ruminates dedicated to milk production is 6.5 kg of CO2e / kg FPCM (milk corrected for its fat and protein content to a standard of 4.0 percent fat and 3.3 percent protein. This is a standard used for comparing milk with different fat and protein contents. It is a means of evaluating milk production of different dairy animals and breeds on a common basis), 5.2 kg CO2e for goats and 8.4 kg CO2e for sheep. This difference is due to the greater production of milk by goats. In terms of meat production, EI are very similar, 24 kg CO2e / kg CW (carcass weight) for sheep and 23.5 kg CO2e / kg CW for goats (Opio et al., 2013).
In terms of production systems, small ruminants have higher EI, both in milk and meat, in grazing systems than in mixed systems (7.6 vs 6.6 kg CO2e / kg FPCM and 24 vs 23.2 kg CO2e / kg CW) (Opio et al., 2013).
Table 1 shown average emission intensity (kg CO2e / kg product) and contribution of CH4 and N2O from this EI for tropical areas of Latin America and Africa (Zhu, Kros, Lesschen, Staritsky, & de Vries, 2016).
Table 1. Average emission intensity (EI) for tropical areas of Latin America and Africa.
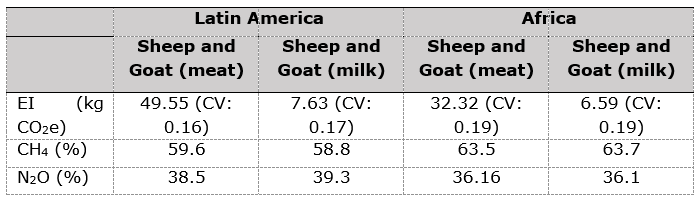
Comparing these values with the global average, the emissions generated in meat production systems in LA and Africa, on average, are 70% higher, and for those generated by systems dedicated to milk production are above 4.5%. This difference can be attributed to the quality of the tropical pastures with higher amounts of structural carbohydrates, higher slaughter ages of the animals and lower milk yields (Gerber et al., 2013; Opio et al., 2013).
(Opio et al. 2013) found in South Asia, East and North Africa and Latin America, EI 29, 27.9 and 25.5 kg CO2e, respectively, for meat production. The same author found for milk production systems, EI between 9.3 and 11.2 kg CO2e for the East and North Africa, and between 5.5 and 9.6 kg CO2e for Latin America and the Caribbean (LAC). (Gerber et al. 2013) found for sub-Saharan Africa and East and North Africa, EI 8.7 and 6.9 kg CO2e / kg FPCM, respectively. The difference between EI (meat) found by these authors in reference to the overall general average was lower than that found by (Zhu et al. 2016), showing increases of 7%, 17.5% and 22% for LA, East and North Africa and South Asia, respectively. However, for systems dedicated to milk production, the increase with respect to the global average was greater, finding differences of 11% (LAC), 27% (Sub-Saharan Africa) and 50.7% (East and North Africa).
GHG emissions from Buffaloes
Buffaloes are present in all parts of the world, however their largest population is found in developing countries, mainly in the continents of Asia and Africa, where the meat and milk of these animals play an important role in feeding of the local populations (Cawthorn & Hoffman, 2014).
Between 2000 and 2013, the population of buffaloes grew by 21.7%, from 164,114,000 to 199,784,000 heads of animals (FAO, 2015). Only South Asia produces 90% and 70% of world milk and meat, respectively (Opio et al., 2013). This productive activity contributes with 0.6 GtCO2e annual (Herrero et al., 2016).
Enteric fermentation remains the most important source of emission, with contributions above 60% of all emissions, both for milk and for meat production (Opio et al, 2013). This enteric CH4 is a byproduct of fiber hydrolysis and fermentation processes that take place in the four stomachs of ruminants, which allows animals to obtain fatty acids and proteins from forages (Pirlo, Terzano, Pacelli, Abeni, & Carè, 2014).
On average, the EI for the buffalo cattle activity at a global level is 3.4 kg CO2e for milk and 53.4 CO2e for meat (Opio et al., 2013). In terms of production systems, EI for grazing systems and mixed systems is very similar, 3.4 and 3.2 kg CO2e / kg FPCM, respectively. However, for systems dedicated to meat production, this EI is broader, presenting values of 36.7 kg CO2e for grazing systems and 54 kg CO2e in mixed systems (Opio et al., 2013).
In tropical areas of Asia and Africa, EI for milk production varied between 2.5 and 5.8 kg CO2e. Regarding systems dedicated to meat production, EI had a wider range, between 21 kg CO2e in East and North Africa and 70.2 kg CO2e in South Asia (Gerber et al., 2013; Opio et al., 2013; Garg, Phondba, Sherasia, & Makkar, 2016). The differences found in the emissions per kg of product may be due to the quality of the food offered to the animals (forages with higher fiber content), different management systems and climatic conditions for each locality (Gerber et al., 2013).
GHG emissions from meat cattle
Meat has become an important source of protein in the diet of human beings, especially in industrialized countries. About 58% of the protein included in the diet of the countries comes from livestock products, of which about 12% is meat (FAOSTAT, 2017). World demand for meat is expected to increase sharply due to the exponential growth of the human population, better incomes and increased urbanization, especially in developing countries (Alexandratos & Bruinsma, 2012).
The population of cattle has reached approximately an inventory of 1,500 million heads, achieving an increase of 14.6% from the year 2000 to 2013 (FAo, 2015). The production of beef cattle has increased in the last three decades almost 40% throughout the world, with America being one of the regions that led this development (FAOSTAT, 2017).
Cattle dedicated to meat production contribute 2.5 Gt of CO2e per year, equivalent to 41% of total emissions from the livestock sector [8]. The largest GHG emissions are produced in Latin America and the Caribbean with more than 800 million tons per year, followed by North America, East and Southeast Asia and South Asia with 400, 380 and 280 million tons per year, respectively (Gerber et al., 2013).
Regarding the emission intensity of meat, the overall average is 46.2 kg CO2e / kg CW, of which more than 42% is attributed to enteric fermentation, the rest is shared between the handling of excreta, fertilization and land use change (Opio et al., 2013).
For the type of systems in which the activity is managed, the EI varies from 42 kg CO2e / kg CW in grazing systems to 38.4 kg CO2e / kg CW in mixed systems. This difference between systems can be due to several factors, among which are time of slaugther, age of calving and better quality of food (Opio et al., 2013).
In developing countries, EI systems dedicated to meat production have the highest values (Caro et al., 2016; Gerber et al., 2013; Patra, 2014). In the last four decades, emissions from these countries almost doubled, going from 663.95 million t CO2e in 1961 to 1286.60 million t CO2e in 2010; while the emission per ton of meat was reduced, from 75.37 t CO2e / t product in 1961 to 35.48 t CO2e / t product in 2010 (Caro, Davis, Bastianoni, & Caldeira, 2014).
Figure 2, is shown in descending order, the highest emissions per kg of product, on average, in different regions (Gerber et al., 2013).
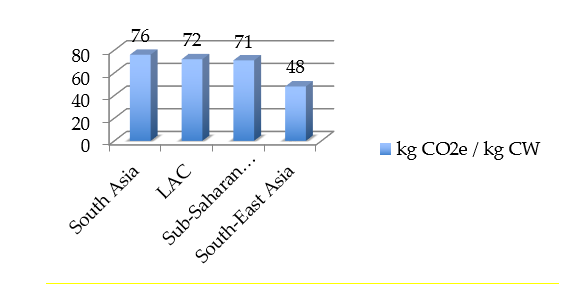
Figure 2. Emissions of CO2e per kg of product in different tropical regions.
However, studies conducted in countries in these regions show emission intensities lower than their averages, for example the case of (Rivera, Guereca, & Rubio, 2016), who found EI of 21 kg CO2e / kg CW in the state of Veracruz - Mexico; (Dick, Abreu, & Dewes, 2015) found in Brazil, EI of 22.52 kg CO2e / kg CW in systems based on natural pastures; (Mazzetto, Feigl, Schils, & Cerri, 2015) obtained for the north of Brazil, EI in extensive and semi-extensive systems of 49 and 48 kg CO2e / kg CW, respectively. The differences found between the regional averages and the point data for an area of a country can be mainly due to the quality, quantity and level of detail of the information used for the estimate (Molina et al., 2017). On the other hand, the differences found between the EI of the same country or between countries, may be due to the different qualities of the pastures offered to the animals, ages at slaughter, level of intensification, climatic conditions, among others (Gerber et al., 2013; Opio et al., 2013).
GHG emissions from dairy cattle
The demand for dairy products in developing countries is directly proportional to the dynamics of its population, however the productivity of the animals (1300 - 5000 kg / milk / cow / year) has remained stable, a fact that has promoted the increase in livestock inventory to meet this need, opposite case in developed countries where productivity per animal has grown steadily in the last 30 years and the stock of livestock has decreased (Alexandratos & Bruinsma, 2012; Lehrman et al., 2014; Wolf et al., 2016).
Of the proportion of GHG (14.5%) of anthropogenic origin that contributes the livestock, 21% is attributed to the bovines dedicated to the production of milk. At a global level, the emission intensity for dairy cattle is 2.8 kg CO2e / kg of FPCM (Gerber et al., 2013). However, emissions per unit of product generated vary widely between regions, with a range between 2 and 9 kg CO2e (Opio et al., 2013). This range of values differs widely with those reported for beef cattle. The difference between the components of the carbon footprint for dairy cattle and beef cattle can be seen in Figure 3, where methane produced in enteric fermentation remains the largest contributor with more than 40% of the total, for both types of cattle.
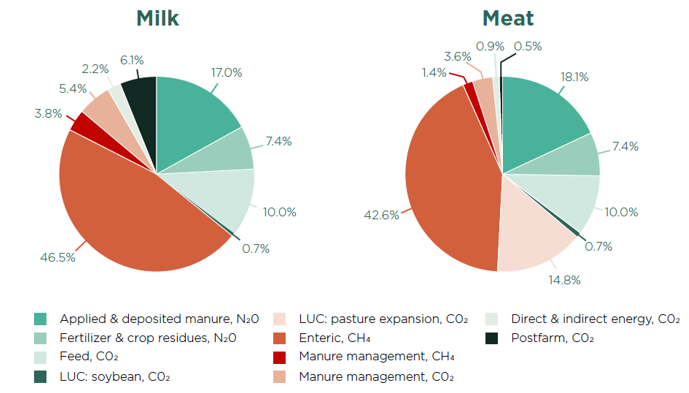
Figure 3. Breakdown of global greenhouse gas emissions attributable to cattle milk and meat by emissions source and gas type (Gerber et al. 2013)
Regarding the type of system, the average EI for grazing systems was 2.9 kg CO2e / kg FPCM compared to 2.5 kg CO2e / kg FPCM for mixed systems. This difference between systems can be explained by several factors such as age at first calving, quality of food and management (Opio et al., 2013).
Table 2 show average emission intensities for different tropical regions by different authors.
Table 2. Emission intensities (kg CO2e / kg FPCM) for different tropical regions
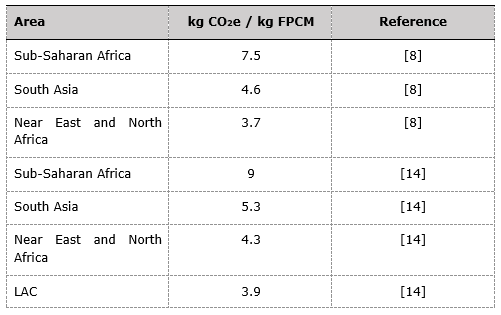
However, studies conducted in countries in these regions show EI lower than their averages, as for example in Kenya, (Weiler, Udo, Viets, Crane, & De Boer, 2014) found EI of 2 kg CO2e / kg FPCM; (FAO & New Zealand Agricultural Greenhouse Gas Research Center, 2017), found average EI of 7.1, 2.1 and 4.1 kg CO2e / kg FPCM for extensive, intensive and semi-intensive management systems, respectively. (Molina et al., 2017) found for the department of Valle del Cauca - Colombia, EI between 5 and 6.3 kg CO2e / kg FPCM, for grazing systems. (Gaitán, Läderach, Graefe, Rao, & van der Hoek, 2016) reported for the department of Matagalpa - Nicaragua, average EI of 2.4 kg CO2e / kg FPCM, of which between 53-67% are attributed to enteric fermentation, 13-17% nitrous oxide of the excreta and 8-15% of the fertilization. The differences found in the EI between regions, countries and within countries can be explained by the levels of intensification of the herds, productivity per animal (EI are inversely proportional to productivity), quality of the food offered to the animals, climate, among other.
MITIGATION OPPORTUNITIES
The mitigation potential of the livestock sector could represent up to 50% of the global mitigation potential of the agriculture, forestry and land-use sector (Herrero et al., 2016). There are technologies and practices that help reduce greenhouse gas emissions by livestock but that unfortunately are not widely used. The emissions per unit of animal product vary widely among production systems, even located in the same areas, a fact that could be explained by the different livestock practices used.
Among the practices and technologies that can be used to reduce emissions are:
1. Genetic selection of animals (Forabosco, Chitchyan, & Mantovani; 2017; Gerber et al., 2013; Hristov et al., 2013):
2. Reduction of herd size would increase feed availability and productivity of individual animals and the total herd, thus lowering CH4 emission intensity (Hristov et al., 2013).
3. Use of highly digestible forages. Increasing forage digestibility and digestible forage intake will generally reduce GHG emissions from rumen fermentation, when scaled per unit of animal product (Hristov et al., 2013). This aspect is important, mainly where the quantities of lignin are high due to the incorrect agronomic management of their pastures. When forage digestibility increases, enteric fermentation and feces production decrease, resulting in reductions in CH4 and N2O (Forabosco et al., 2017; Gerber et al., 2013).
4. Use of feed additives. Several chemical compounds, such as alternative electron receptors, ionophoric antibiotics, enzymes and probiotic cultures, have been tested for their ability to decrease CH4 emissions, mainly in short-term; their effects are often much reduced in the long term due to adaptation of the rumen microbial ecosystem (Herrero et al., 2016).
5. Silvoparil systems as an alternative to achieve GHG decreases per unit of product generated. The inclusion of shrubs such as Leucaena leucocephala and Tithonia diversifolia for animal feed, optimization in fertilization (reduction in the use of chemical fertilizers), balance of the diet that decreases the excretion of nitrogen. On the other hand, the implementation of agroforestry systems creates a microclimate in paddocks that allows animals to mitigate the heat stress caused by high temperatures due to climate change (Lerner, Zuluaga, Chará, Etter, & Searchinger, 2017).
6. Soil carbon sequestration. Grazing-land management practices that affect species composition, forage consumption, nutrient and water inputs and fire can impact soil carbon stocks. Excessive removal of aboveground biomass, continuous grazing at suboptimal stocking rates and other poor grazing management practices that result in a mismatch between forage supply and animal demands have led to the depletion of soil carbon stocks (Herrero et al., 2016).
CONCLUSIONS
The review carried out on the contribution of greenhouse gases (CH2 and N2O) emitted by livestock (sheep, goats, cattle and buffalo) practiced in tropical areas indicates that the emission intensities vary between medium and high, due to low productivity of animals, poor quality of food and lack of knowledge about appropriate technologies for the zone. The differences found in EI between regions, countries within the same region and places within the same country, are indicative that reducing GHG production by livestock is possible.
IPCC and LCA methodologies are important tools used to estimate GHG emissions from livestock, providing an important starting point to calculate its contribution and understanding the sector’s potential for mitigating emissions; however, is very important including soil carbon sequestration in this tools, especially in farming systems where grasslands are a substantial resource for animal feeding with high potentials of carbon sequestration.
Livestock in tropical areas is associated with extensive systems generating large amounts of greenhouse gases, therefore, a shift towards more intensive management, improvement of pastures and inclusion of agroforestry, improvement of diet and selection of more efficient animals, could cause significant reductions in emissions.
Emission of CH4 from enteric fermentation was the major hotspot in livestock systems. Improving forage quality and the overall efficiency of dietary nutrient use is an effective way of decreasing GHG emissions per unit of animal product.
Finally, management strategies adaptable to the conditions of the zones and economically viable should be sought that provide benefits in terms of adaptation to climate change, mitigation of GHG emissions, and that increase the productivity and profitability of farmers located in tropical areas.