An environmental noise study in the industrial, commercial, residential areas and arterial roads in western Bogotá, Colombia
Un estudio de ruido ambiental en el sector industrial, áreas comerciales, residenciales y arteriales en el oeste de Bogotá, Colombia
Marco Andrés Guevara Luna2,3, Fredy Alejandro Guevara Luna1
1Departamento de Ingeniería Química y Ambiental, Universidad Nacional de Colombia. C. P. 111321. Bogotá, Colombia. Dirección Carrera 45 # 26-85.
2Departamento de Ingeniería de Procesos, Smart & Simple Engineering - S&SE S.A.S., C. P. 111321 Bogotá, Colombia, Dirección: Cll 63f # 80ª-65
3Escuela de Ciencias Agrícolas, Pecuarias y del Medio Ambiente (ECAPMA), Universidad Nacional Abierta y a Distancia (UNAD), C. P. 111511 Bogotá, Colombia, Dirección: Calle 14 Sur No. 14 – 23 Sede José Celestino Mutis.
Corresponding author: marco.guevara@unad.edu.co
Abstract
Noise pollution as byproduct of development and urban activity is related with a great amount of economic, social and cultural variables, whose importance as stressing, and possible even dangerous, agent in human life has come to be recognized in the last decades. In this case the megacity of Bogotá is a capital city of Colombia, located in the center of the country. Bogotá is a very variable city in terms of economic and social level location and use of soils in the city planning. The factors mentioned above makes Bogotá a very complex analysis system for sound and noise pollution studies. Due the size of the city, in this study the western area of the capital district is analyzed through some sound measurements in 7 different selected types of areas, involving commercial, transportation, industrial, residential and arterial roads. The main target of this study is to identify the most important noise sources in the western area of the city. This study allowed to identify the arterial roads as one important source of noise in the city, possibly due to the traffic o heavy vehicles inside the city. The max harmful levels of sound reach values of about 85 dB in the mentioned locations (Av. Ciudad de Cali, Av. Cll 13 arterial roads and Salitre – El Greco Transmilenio Station), exceeding the permitted limits of 75 dB(A) according to the environmental local regulatory authorities.
Keywords: Noise pollution, environmental noise, public health, sound measuring, environmental policies.
Resumen
La contaminación acústica como subproducto del desarrollo y la actividad urbana está relacionada con una gran cantidad de variables económicas, sociales y culturales, cuya importancia como agente estresante, e incluso peligroso, en la vida humana ha llegado a ser reconocida en las últimas décadas. En este caso, la megaciudad de Bogotá es la ciudad capital de Colombia, ubicada en el centro del país. Bogotá es una ciudad muy variable en términos de ubicación de nivel económico y social, y uso de suelos en la planificación de la ciudad. Los factores mencionados anteriormente hacen de Bogotá un sistema de análisis muy complejo para estudios de contaminación acústica y sonora. Debido al tamaño de la ciudad, en este estudio se analiza el área occidental del distrito capital a través de mediciones sonoras en 7 diferentes tipos de áreas seleccionadas, que incluyen carreteras comerciales, de transporte, industriales, residenciales y arteriales. El objetivo principal de este estudio es identificar las fuentes de ruido más importantes en el área occidental de la ciudad. Este estudio permitió identificar las carreteras principales como una importante fuente de ruido en la ciudad, posiblemente debido principalmente al tráfico de vehículos pesados en el interior. Los niveles máximos y dañinos de sonido alcanzan valores de aproximadamente 85 dB en los lugares mencionados (Av. Ciudad de Cali, Av. Cll 13 vías arteriales y Salitre - Estación El Greco Transmilenio), excediendo los límites permitidos de 75 dB (A) de acuerdo con las normas de regulación de las autoridades ambientales locales.
Palabras Clave: Contaminación acústica, ruido ambiental, salud pública, medición sana, políticas ambientales.
Introduction
New advances in sciences and technology have large impacts in the society. Those impacts goes through economic, cultural, health and social issues. However, progress also entails some significant drawbacks that would be preferably avoided, or at least minimized. One such case is noise pollution, whose importance as stressing, and possible even dangerous, agent in human life has come to be recognized in the last decades (Barrigón Morillas, Gómez Escobar, Méndez Sierra, Vílchez Gómez, & Trujillo Carmona, 2002; de Noronha Castro Pinto & Moreno Mardones, 2009; Hunashal & Patil, 2012; Silva & Mendes, 2012; USEPA – US Environmental Protection Agency, 1978; Zannin, Diniz, & Barbosa, 2002). Regarding noise pollution in large cities several impacts in human health, and finally public health, have been clearly identified and studied. Also impacts of noise levels over animals and local species such as birds have been identified before (Francis, Kleist, Ortega, & Cruz, 2012; Istrate, Oprea, Rada, & Torretta, 2014; Ortega, 2012).
The effect of noise pollution in different location all over the globe deeply depends of several variables: level of development, total population and population density, kind of activities involved, culture, local habits, geographic location, soil usage, etc. the factor described above make necessary to characterize carefully the site and the situation under the study (Barrigón Morillas et al., 2002; Fiedler & Zannin, 2015; Silva & Mendes, 2012).
The city of Bogotá is a capital city of Colombia, located in the center of the country. Bogotá is the largest city in Colombia with a population of 10,700,000 of habitants in the metropolitan area and a surface extension area of 1,580 km2(DANE, 2006). Bogotá is a very variable city in terms of economic and social level location, and use of soils in the city planning(Ramírez et al., 2018). Even when Bogotá has regulations and public administration entities in charged to the monitoring of noise pollution emissions (Secretaria Distrital de Ambiente, 2006, 2010a, 2010b), there is concern about the actual situation of the city in sound level aspects and other contamination forms of the environment (Ramírez, Mura, & Franco, 2017).
All the factor mentioned above makes Bogotá a very complex system to be taken as object of study in any technical field, in this case sound and noise pollution. Due the size of the city, in this study the western area of the city is analyzed through some sound measurements in 7 different selected types of areas, involving commercial, transportation, industrial, residential and arterial roads.
The main goal of this study is to define the noise levels in the western region of the capital city of Bogotá for 3 types of locations: commercial (Gran estación and Diverplaza), transportation (Salitre- El Greco Transmilenio station), industrial areas, residential and arterial roads (Av. ciudad de Cali and Av. Cll 13). Other important target of this research is to identify the most important noise sources in the locations established for the study founding the base for further researches and stimulating actions by the local public regulation institutions.
This research was performed using measurements for the 7 selected locations of the city region during 30 minutes, according to the established procedures by the local authorities standards, for a selected dates(Secretaria Distrital de Ambiente, 2006). Sonometer CIRRUS 162-B CLASS 2 was used.
This first study allowed to identify the arterial roads as one important source of noise in the city, possibly mainly due to the traffic o heavy vehicles inside the city. The max harmful levels of sound reach values of about 85 dB in the mentioned locations (Av. Ciudad de Cali, Av. Cll 13 arterial roads and Salitre – El Greco Transmilenio Station) exceeding the permitted limits of 75 dB(A) according to the environmental local authorities regulation standards (Francis et al., 2012; ISO, 2003, 2007, Secretaria Distrital de Ambiente, 2006, 2010a, 2010b; USEPA – US Environmental Protection Agency, 1978).
METHODS
There is extensive studies regarding methods to study the sound levels in cities with different characteristics. In this case the size of the City makes necessary the use of an specific approach suggested Brown and Lam (Brown, 1991; Brown & Lam, 1987). This strategy is described as based in the selection of sampling points using a suitable classification of the urban noise and the location where this will be measured.
The approach mentioned above has been implemented successfully in previous researches(de Noronha Castro Pinto & Moreno Mardones, 2009; Hunashal & Patil, 2012).
Based in this principle of sampling for the development of the study, the western area of the city of Bogotá was selected, and inside this area 7 places were chosen to be the sampling points for the measurements during 30 minutes, according to the established procedures by the local authorities standards, for a selected dates(Secretaria Distrital de Ambiente, 2006). These standard establishes a maximum level of noise allowed according to the local soil usage, for the areas under study the maximum value is 75 dB(A), and the minimum measuring time is 15 minutes.
Data processing was performed using python® version 3.6(Anaconda Python, n.d.). The Spyder IDE was the graphical user environment used for the code development.
Places
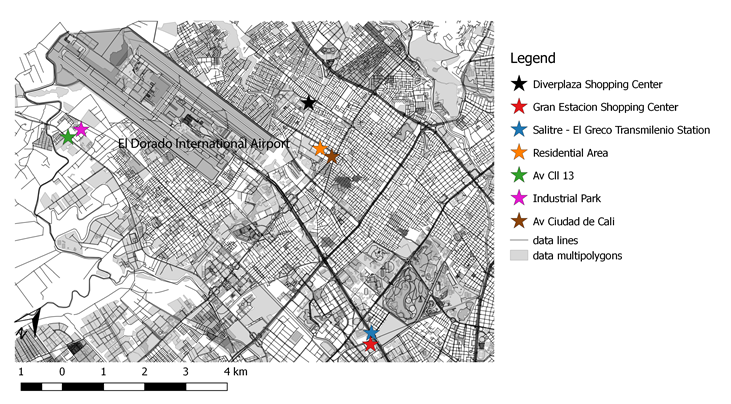
Based in the method described before for the noise study, the 7 sampling points in the western part of the city are shown in (Figure 1). The coordinates of the sampling points are tabulated in (Table 1). The selected sampling points were pretended to be placed in locations of normal exposure of people. Also, all locations are in exterior-public sites with a great people traffic and concurrency in normal hours during the day, and particularly in the sampling hour.
Figure 1. Measuring points location for this study according to the analysis strategy defined (This Research).
Measuring instrument
The sonometer used for this study was the CIRRUS 162-B CLASS 2 (CIRRUS Research plc, 2017). The Universidad Nacional de Colombia supplied the measuring equipment. Technical personnel of the institution performed the calibration of the equipment in January 2017, using the calibration kit provided by CIRRUS.
Measuring procedure
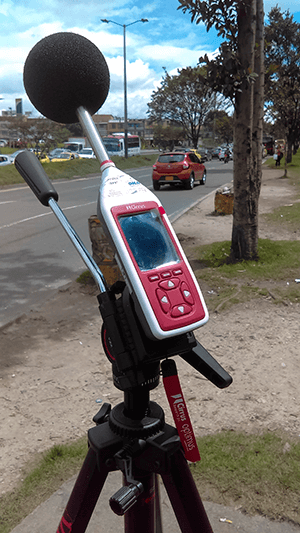
The data sampling was developed using the instrument described before over a tripod (Figure 2). The time of measure was at 11:00 am on Monday for all the sampling points. The measuring location points information is summarized in Table 1. The measuring time in each location was of 1800 seconds (30 minutes).
Figure 2. Measuring instrument, location of AV. Ciudad de Cali (CIRRUS Research plc, 2017) (This Research).
RESULTS AND DISCUSSION
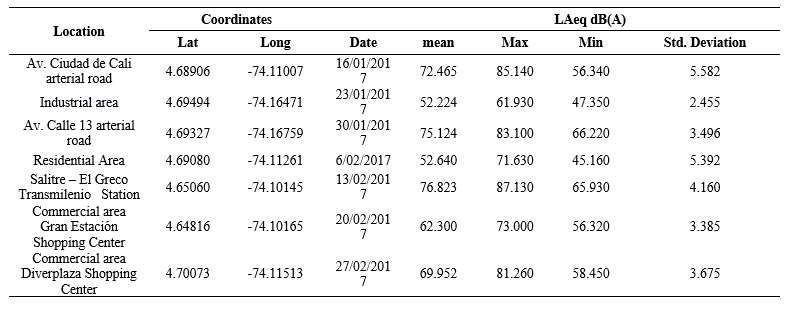
The data measured in the 7 differents locations along the western region of Bogotá is summarized in (Table 1). The data considered corresponds to the LAeq levels measured by the instrument. Data saved by the memory log of the measurement instrument have a temporal resolution of 1 s.
Table 1. Measured sound data summary, and geographical locations.
The data were collected shows notable average and maximum levels for arterial vehicular roads and the transportation station (Av. Ciudad de Cali, Av. Cll 13 arterial roads and Salitre – El Greco Transmilenio Station). The mean levels are above 70 dB for LAeq, which are normal levels of noise in public sites. Even so, for these locations mentioned the max sound levels reach values of 85.140, 83.100 and 87.130 dB(A) respectively, that means these places are approaching harmful levels of noise with possible sensible effects in the public health of the city population of this part of the city.
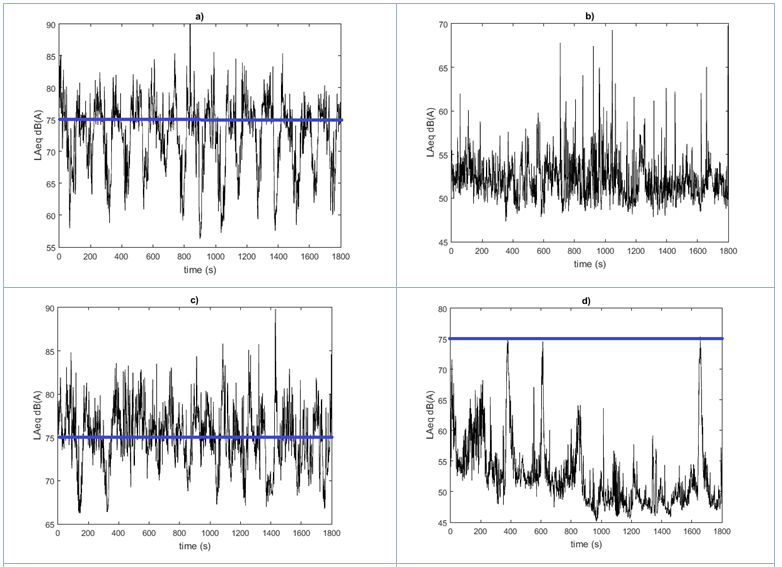
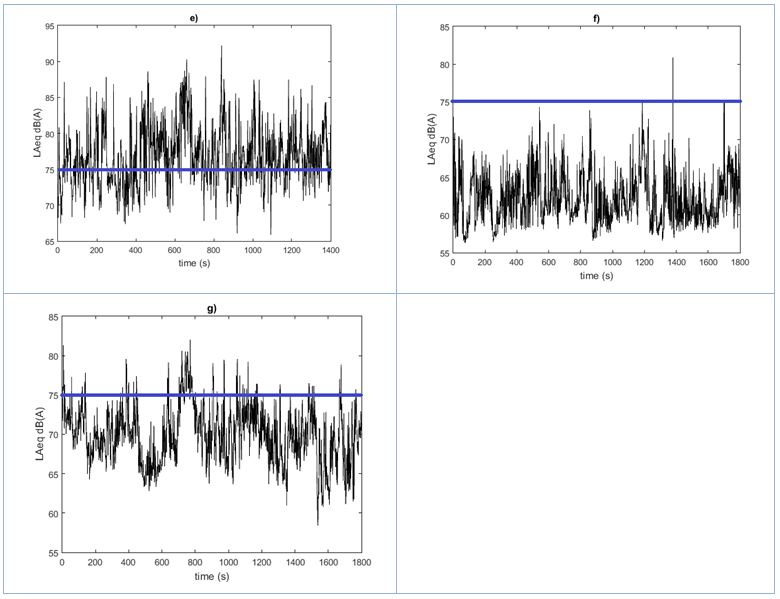
The peaks of the sound levels during the data sampling can be better observed graphically, the (Figure 3) shows the time series of the LAeq sound levels for the 7 sampling sites. In all the locations there is notable peaks observed, but the scale of the arterial vehicular roads and the transportation station mentioned have considerable higher values of max levels. These observations make possible to correlate the presence of vehicular activity with high noise levels, even with greater impact than the industrial area in this case.
Figure 3. Sound measurements time data series (LAeq units in dB(A)), blue line according to allowed local noise level: a) Av. Ciudad de Cali road, b) Industrial area, c) Av. Cll 13 road, d) Residential area, e) Transmilenio Salitre - El Greco station, f) Commercial Area Gran Estación shopping center, and g) Commercial area Diverplaza shopping center.
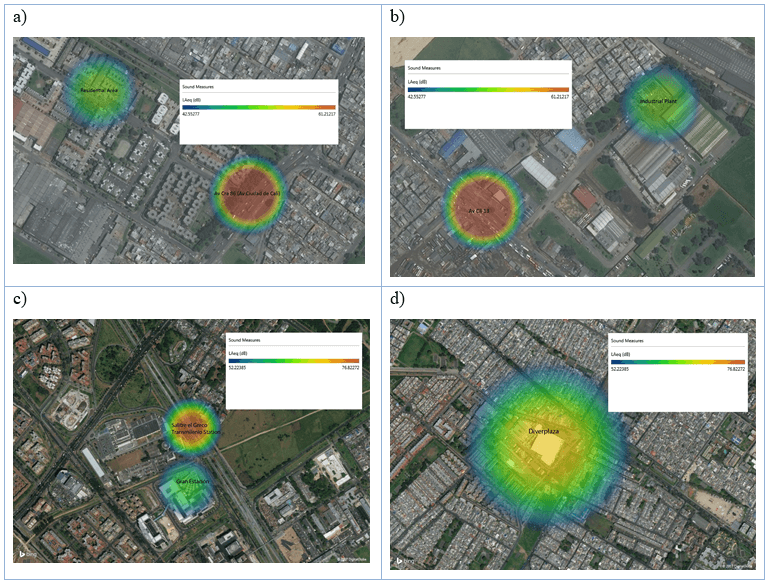
To qualitative compare the noise levels of the locations defined as sampling points, the contour maps of noise levels are shown in (Figure 4). Again, the levels of noise for the locations mentioned before are in comparison higher as expected. The commercial and residential areas have normal sound levels, even when the noisy locations are close in spatial terms.
The industrial area possible has in this case relatively low noise levels due to a low working intensity in the plants the day of the measurement. It is natural to expect higher sound levels in this type of area, further studies and measuring campaigns can bring additional data and results to take better planning decisions about the location of this kind of areas and its impacts. In addition, studies in-door in the commercial areas are necessary to analyze the situations inside shopping centers in Bogotá.
The arterial road in this study have the significative feature of high proportion of heavy vehicles in traffic. This aspect makes important the roads in terms of noise and atmospheric pollutants to the areas inside the city, and the effects in the population(Fiedler & Zannin, 2015; Pathak, Tripathi, & Mishra, 2008; Ramirez & Dominguez, 2013).
Figure 4. Sound Maps (LAeq units in dB(A)): a) Av. Ciudad de Cali road and Residential area, b) Industrial area and Av. Cll 13 road, c) Transmilenio Salitre - El Greco station and Commercial Area Gran Estación shopping center, d) Commercial area Diverplaza shopping center.
CONCLUSIONS
The sound levels of 7 different places were measured and summarize in this study. The sound levels measured were compared between them and with the harmful levels standard regulation values as 75 dB(A)(Secretaria Distrital de Ambiente, 2006), and its implications in human health. The arterial vehicular roads and the transportation station (Av. Ciudad de Cali, Av. Cll 13 arterial roads and Salitre – El Greco Transmilenio Station) where the location with higher levels of noise, in terms of peaks for the max and mean levels. For these locations, the max sound levels reach values of 85.140, 83.100 and 87.130 dB respectively, the mean values are about 70 dB lightly under the maximum allowed level.
For the data collected standard deviations between 3.385 and 5.582 dB(A) were obtained. These variability in the data measured means that the sound levels trend to be stable at the mean values for each dataset. The location with the higher variability is the residential area, and the location with the lower variability is the commercial area.
The max values measured of about 85 dB are high enough to be harmful and affect negatively the people health, and therefore affecting the public health aspects of the city. These high levels can be related with the strong presence of heavy vehicles in the traffic roads inside the city. The regulations of heavy vehicles traffic inside the city must the regulated to mitigate problems of noise pollutions taking this study as art of the technical evidence, and other issues regarding atmospheric contamination can be improved as well. In addition, Negative impact of high noise levels in public health will generate economic loses to public budged of the city.
Further studies in other city locations are required to fully observe and understand the behavior of the city features in relation with noise pollution. This study was developed in external-public environments, will be also important to investigate about noise pollution in-door for many common environments of the city, such as: shopping centers, schools, hospitals, offices, transport terminals and portals. The results obtained can be useful to public administration entities in the future to make a suitable planning of the use of different areas inside the city and in its surroundings.
El Dorado international airport was not considered in this case, but will be interesting to consider the contribution of aircraft traffic in the city to the noise pollution situation actually and in the future.
ACKNOWLEDGEMENTS
Authors wish to express their gratitude to: S&SE S.A.S (Smart and Simple Engineering S.A.S) in Colombia for financing this project and support this innovation environment since the very beginning, and the Universidad Nacional de Colombia for providing the measuring instrument and technical assistance for the development.
LITERATURA CITADA