Vehicle recognition by using acoustic signature and classic DSP techniques
María Fernanda Díaz Velásquez & Jorge Eduardo Guerrero Ramírez
1Ingeniero Electrónico, Especialista en Redes de Comunicación, Magíster en Ingeniería con énfasis en Ingeniería Electrónica, Doctor en Ingeniería Mecánica. 2Ingeniero Electrónico, Magíster en Ingeniería con Énfasis en Ingeniería Electrónica
1, 2Grupo de Investigación GIEIAM. Universidad Santiago de Cali. Cali, Colombia
1direlectronica@usc.edu.co, 2jorge.guerrero00@usc.edu.co
Abstract
This paper shows the application of the classic technique of digital signal processing (DSP), the cross-correlation, used for the detection of acoustic signatures of road traffic in Cali city, Colombia. Future goal is to build a detection software that through real time measures allows us estimate the levels of acoustic pollution in the city by using simulation models of road traffic, in the framework of environmentally-friendly smart cities. Final results of the experimental tests showed an accuracy of 71.43% for specific vehicle detection.
Key-words: Acoustic signature, correlation, vehicle traffic
Introduction
Progress in the cities comes with the development of buildings, and housing benefits due to motor based vehicles and other services that satisfy the needs of the people and bring some comfort. This progress causes at the same time environmental degradation, specifically with the decrease of life quality of the citizens due to the rise of noise levels. Santiago de Cali is the third biggest city of Colombia and according to the statistics shown by the Secretary of transit and transport of Santiago de Cali, the city's vehicle traffic has increased by 104,66% between the years 2002 and 2014 (de Santiago de Cali, 2016; Garcia, 2015). Nowadays, some places in the city are facing high levels of acoustic pollution, which is mainly generated by road traffic and also by different entertainment activities. This growth alerts us about a noise problem which harms the quality of life of inhabitants of Cali, and could lead to some pathologies such as: Hearing, psychological disease and sleeping disorders (García et al., 2003). Also, new researches by Dr. Julio Díaz PhD, current tenured scientist in National School of Sanity in the Carlos III Institute of Madrid, proved that the traffic noise leads to some deaths caused by some diseases like diabetes, respiratory failures and cardiovascular disorders (Tobías, A., Díaz, J., Recio, A., Linares, 2014).
In 2012, during a conference in Rio de Janeiro, United Nations showed that by the year 2030 it is expected that 60% of world population will live in the cities, this results to a whole development under the framework of the need of environmentally-friendly smart cities, which requires the next characteristics: Smart citizenship, transportation, government, life and environment (Europeo, 2014). This project contributes to a smart environment, which consists in the development of a system that identifies the acoustic signature of vehicles in some fixed measuring places in the city, by using digital signal processing. This data will feed a simulation model of the road traffic in real time, which will estimate the noise pollution caused by road traffic, considering that the road traffic causes the 80% of noise pollution in the city (Recuero Lopez, 1999; Segués, 2005).
Several works have used neural networks and Bayesian sub-spaces to recognize the acoustic signature (Kandpal et al., 2013; Lu et al., 2008; Rahim et al., 2010; Munich, 2004). In this work we have explored some analytic algorithms in the time domain using Matlab, in which we have made the tests of some classic techniques for vehicle recognition.
Theoretical background
A. Correlation of signals
Correlation is a mathematical procedure whose objective is to measure the similarity between two signals and thus extract some information (Proakis et al., 1996). Correlation of signals if often encountered in radar and sonar applications.
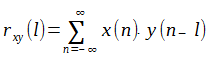
Two real signal sequences x(n) and y(n) have finite energy. The cross-correlation of x(n) and y(n) is defined as
Where l=0,+/-1, +/- 2, …, is the shift or lag parameter.
The cross-correlation rxy(1) attains its maximum value at zero lag if x=y , that is, autocorrelation. Otherwise, the maximum value is obtained at a lag in which x(n) and y(n) are more similar.
B. Radar Model
Suppose that x(n) and y(n) are two signal sequences that represent audio signals. In radar/sonar models, x(n) represents the transmitted signal and y(n) represents the received signal. If a target is present in the space of search, y(n) is a delayed version of the transmitted signal reflected from the target, and corrupted by additive noise. The received signal can be represented as
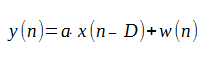
where a is an attenuation factor of the signal x, D is the time delay, and w is the background noise. By using cross-correlation, the maximum value of rxy(1)is when l=D.
C.Recognition of acoustic signatures
In order to recognize the acoustic signature of road traffic, we have used the cross-correlation and the radar model. For this case, from equation (2), x(n) represents the acoustic signature of a car that we want to detect, and y(n) represents the sound recorded in real environment. If the target car is present, the cross-correlation will have a maximum value at a lag corresponding to the time the car is recorded.
Experimental platform
Figure 1 shows the block diagram of this experiment, including connections and devices for the acoustic signature detection system. In the capture step, we have used the device Alesis Twotrack, a portable sound record that records audio signals using 16bits and a sample rate of 44.1 kHz. Moreover, this record device was selected due to its condenser microphones, that lead to high quality sound record (Alesis.com, 2011).
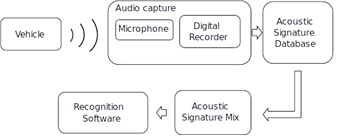
Figure 1. Block diagram of experimental platform
We have recorded the sound caused from different kinds of transportation media, such as bikes, trucks and automobiles, using the portable digital recorder. Our database has 68 records, which we have used as reference for acoustic signatures. Next, by using a sound edition software, we have prepared some sound mixes of the acoustic signatures in order to feed the recognition software and assess its performance. Finally, in order to perform the final tests, we have recorded audio an video in real environment, thus, by synchronizing video and live sound records, we were able to validate recognition of detected cars.
Algorithmic technique for acoustic signature
The algorithm for recognition of acoustic signature of a vehicle is based on the cross-correlation. Correlation itself is not suffice to detect presence of an specific car from an acoustic signal, it is necessary to perform additional steps of filtering and decision after the correlation step.
D.Recognition
According to preliminary tests, cross-correlation of two acoustic signals will give a measure of similarity between both signals. In the case of a specific vehicle, correlation will deliver one peak in the signal when the car sound is present in both signals. However, there are many other factors which could affect the correlation results and we will find several extra peaks inside, the main sources we can find in this case are other vehicles and background noise. Figure 2 shows correlation results when a vehicle is correctly detected, in this case, we can see clearly the peak signal. Figure 2 shows correlation results when no car is detected, in this case, we can see several peaks in the signal, which are generated by other cars or by background noise. In order to avoid false detections, we have developed the filtered step.
E.Filtering
Comparing the correlation results, when the vehicle sound is present in both signals and when it is not, the maximum peak is considerably higher than the rest of the signal for the first case, but it is not so remarkable for the second case. Taking this into account, we have applied one IIR low-pass filter1to the correlation results signal, in order to remove sharp peaks (high frequency signals), and compare the new maximum peak against the original one. If the obtained peak comes just from noise, as we can see in Figure 3, filtered signal will preserve its values, and maximum peak will remain close to the original. If the peak comes from a target car, as we can see in Figure 2, filtered signal will preserve noise values, but the higher peak will be removed, so the maximum peak is now considerably lower than original peak. Finally, by comparing the relation between peaks, the software can decide if the target vehicle is present or not in the sound sample.
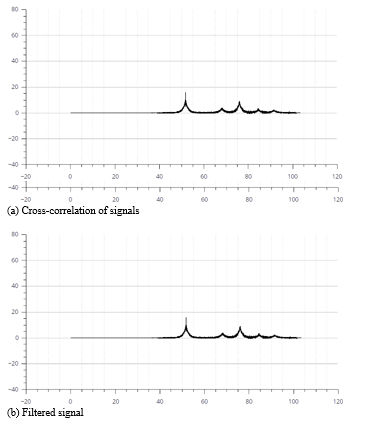
Figure 2. Correlation results when a vehicle is detected
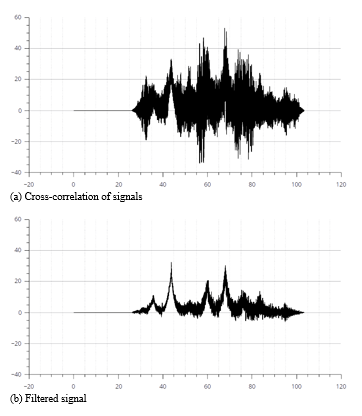
Figure 3. Correlation results when no vehicle is detected
F. Classification
Classification step involves a loop for each acoustic signature stored in the database, that is, for each specific vehicle we want to detect, it is necessary to perform cross-correlation, filtering and decision steps, as show in Algorithm 1. When one vehicle is detected, the count of that classification is increased, and final results can be used to obtain statistical data, which could feed the noise map simulator.
Experimental results
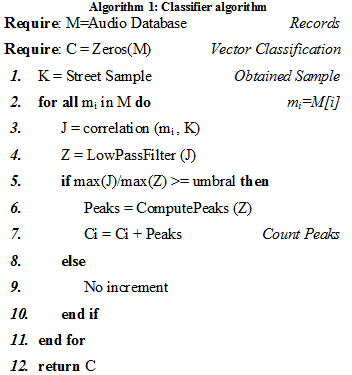
We have made some experimental tests of our algorithm by recording audio and video in a busy street during 350 seconds, time in which several vehicles crossed the street, including our test car. Using the video reference, we gathered data of the vehicles including vehicle type and crossing time. For the target car, we have taken two acoustic signature samples: a ) The car is a constant speed, and b ) The car is speeding up. Figures 4 and 5 show the results timeline of acoustic detection using both signatures and the sample of 350 seconds. By the time the algorithm detects a local peak, it generates two values: Detection  , which corresponds to the peak value in correlation, and Peak relation
  , that is the relation between the original correlation peak and the filtered signal peak. The figures also show the time in which the vehicles are crossing the measuring place: Target car
  , other cars
  and motorcycles
  .. Visual inspection allows us to check the accuracy of detection.
Signature samples last some seconds, therefore, the peaks obtained from cross-correlation process are not exactly located in the same time the event happens, the shift of these peaks depends of the length of the signature sample, which could last between 3-5 seconds approximately.
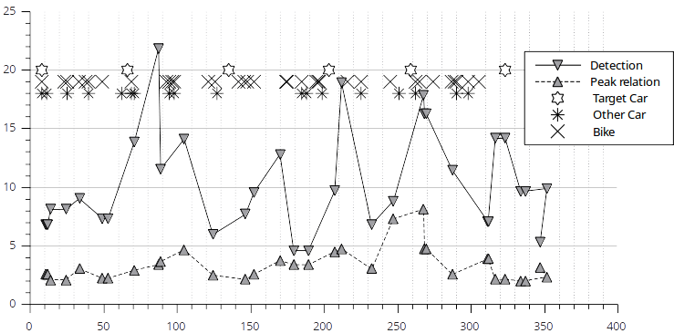
Figure 4. Detection results for signature a
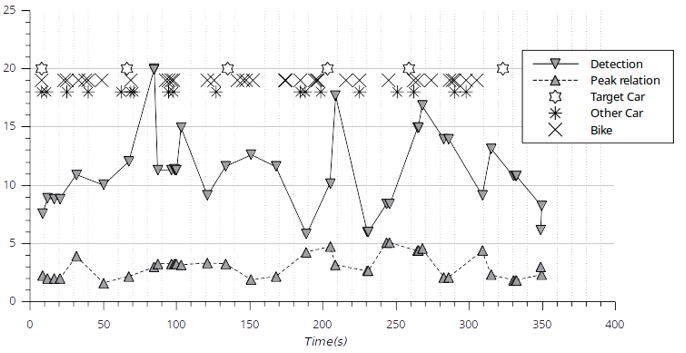
Figure 5. Detection results for signature b
Conclusions
According to the results achieved in this experiment, the cross-correlation technique by itself is not enough to obtain the accurate detection of the acoustic signature of vehicles. Current technique requires pre-computing steps in the detection software, involving filtering steps using IIR Low-pass filter. FIR filters were previously tested, which prove the need of a huge order FIR filter (N>1000), while the IIR filter had much lower order (N=6) with better results, which leads to decrease computation time.
Detection software produced detection signals for 71.43% cases where the target car is present, and for 14.3% of detection cases it was a false detection.
Future works will lead to improvements in detection algorithm and use of more sophisticated algorithms, such as wavelet transform and artificial neural networks, as suggested by other authors.
Cited literature